32. Text: Small Multiples & Dual Axis
Text Recap of Previous Video
Small multiples
Small multiples are one of my favorite visualization techniques and Tableau loves them too. Simply dragging multiple dimensions to the Columns and Rows shelves creates a small multiple. You saw this before when learning about hierarchies.
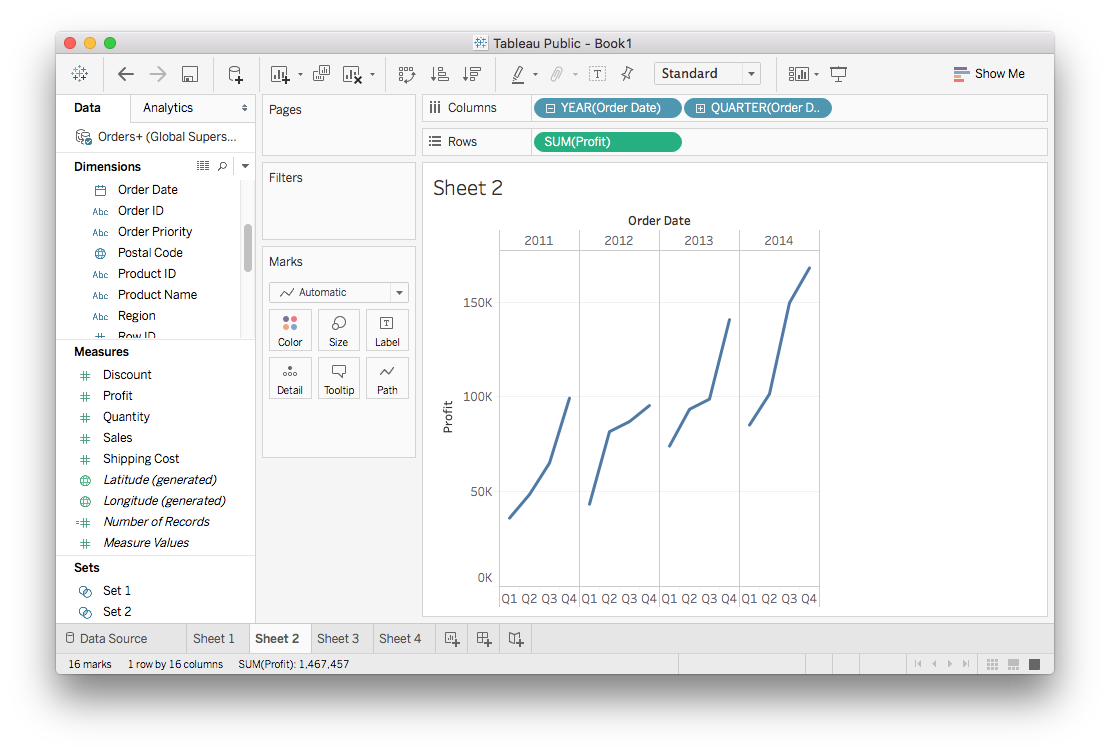
Here we have four separate plots showing how the profit grows each quarter through the four years in the data set. You'll notice the plots are distributed horizontally due to the Order Date fields in the Columns shelf.
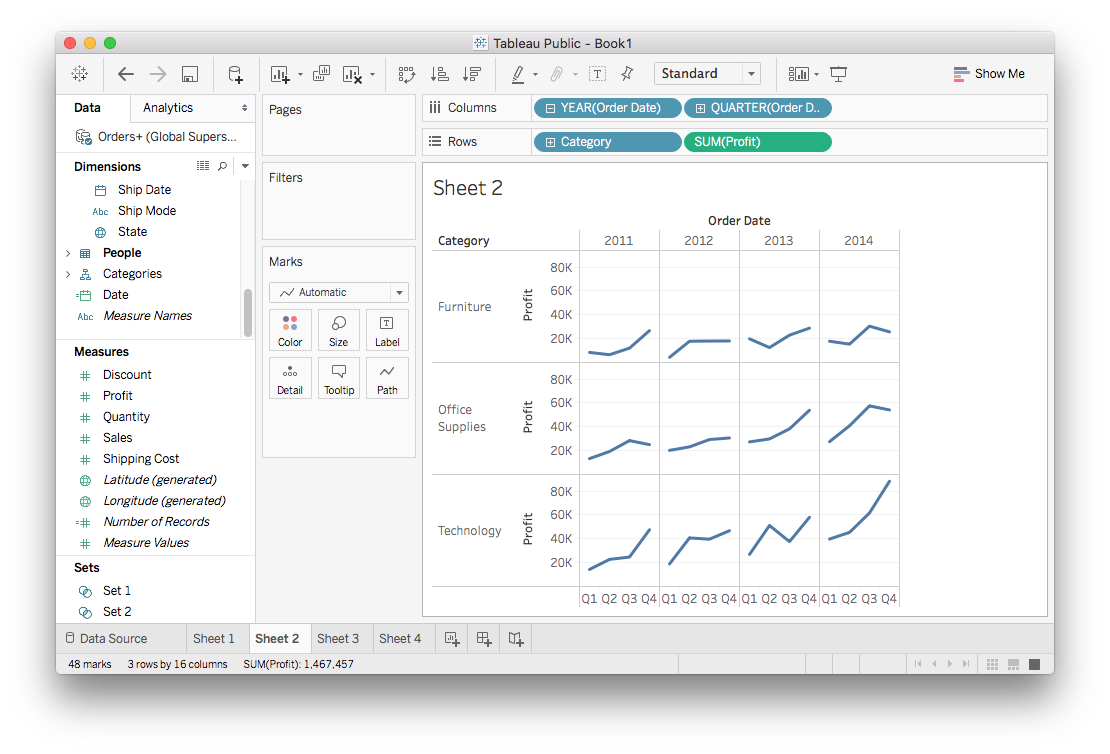
But, what's driving this growth? Maybe one category is the profit leader. You can see this by dragging Category to the Rows shelf. This will create more plots with the data split by Category distributed vertically.
Dual Axis
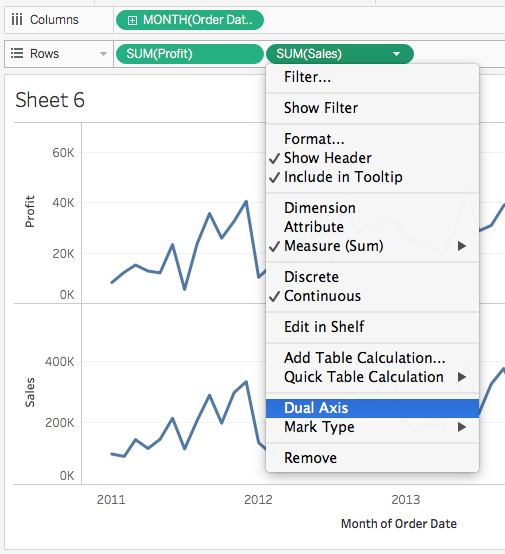
Sometimes you'll want to compare two variables on one plot. If you drag two measures to the Rows shelf, you get two plots instead of one. For example, let's try plotting both the profit and sales on one figure. Drag Profit and Sales to the Rows shelf, you should get something like the image below.
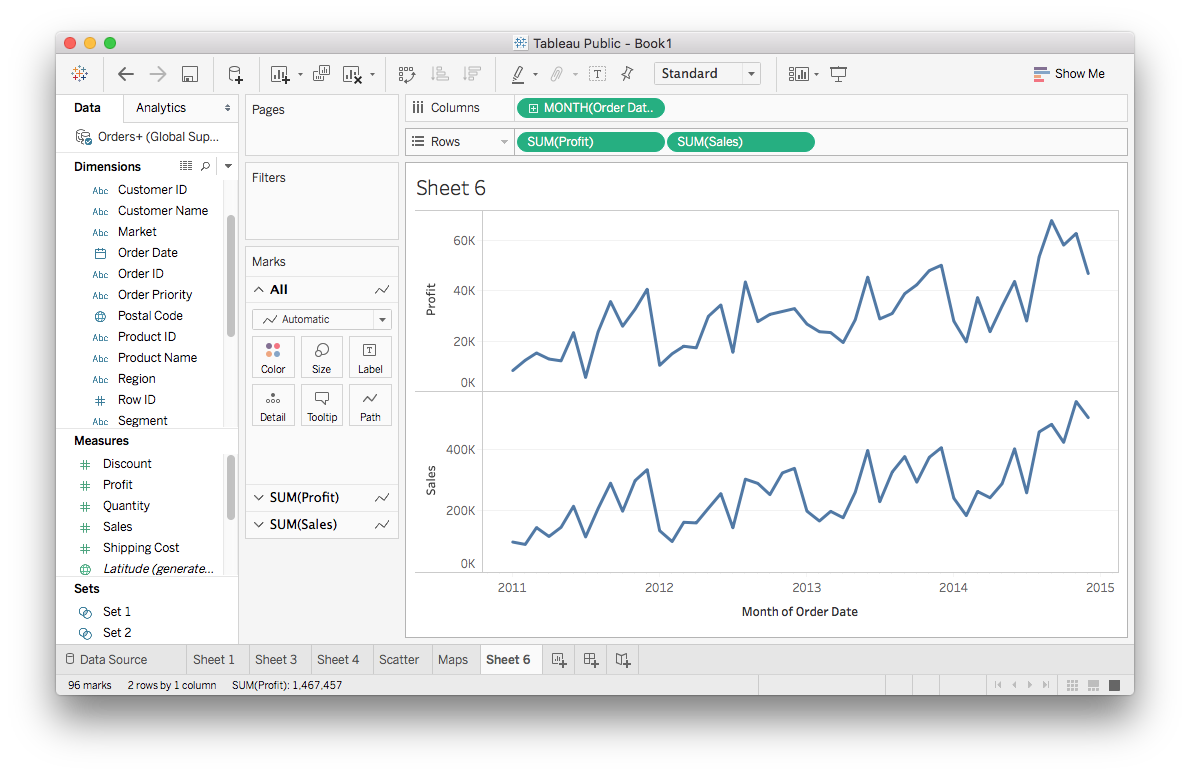
Here you get two plots, but we really just want one. You can convert this to both lines on one plot by opening the menu one of the measure pills and selecting "Dual Axis".
It should look like this:
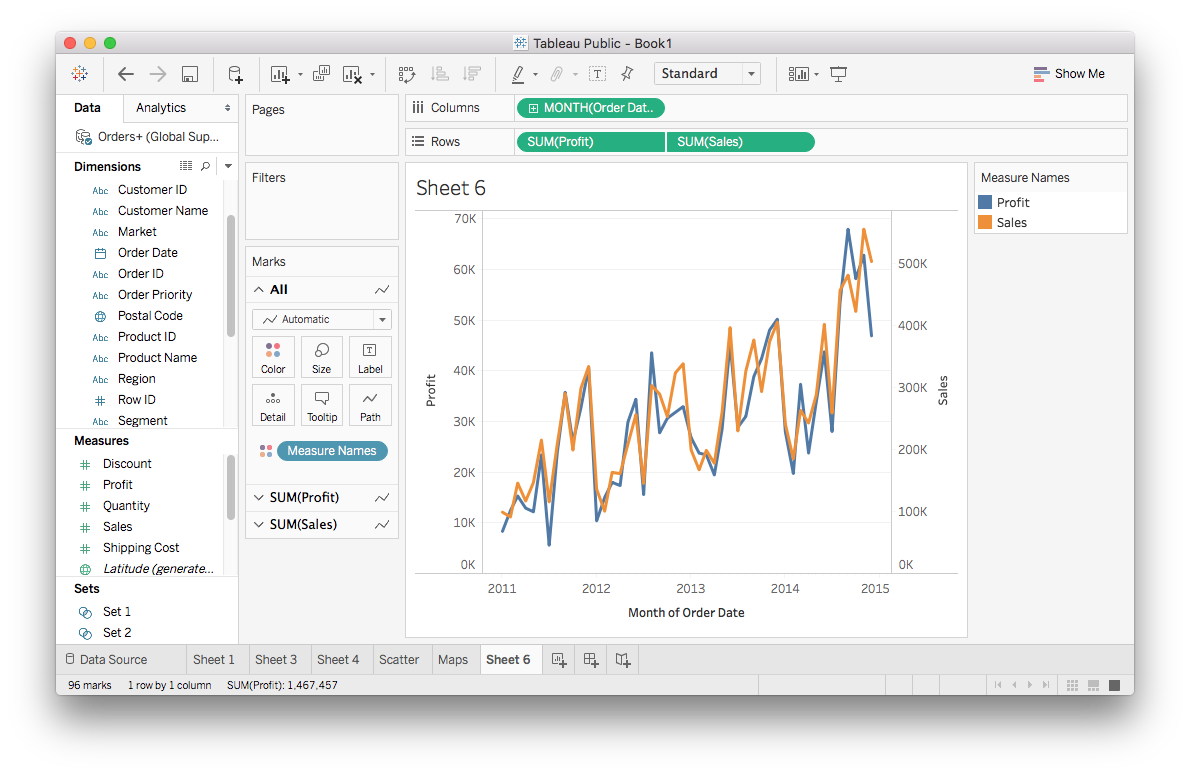
You can do a little shortcut by dragging the second measure to the right side of the view.
